

October 2022 ARVIC
The October 2022 ARVIC conference brought together insights practitioners from major consumer brands to share hands-on methods for connecting behavioral data, scaling research operations, and communicating findings with greater credibility and impact.
- 01Jobs to Be Done in the Real World: A Case Study from Promethean
- 02Leveraging User Behavioral Data for Smarter Email Surveys
- 03Mind the Gap: Elevating Your Research Presentations
- 04Sharing the Power of Rapid Research: A Self-Serve Program for Cross-Functional Teams
- 05Using Mobile App Engagement Data as an Indicator for Brand Loyalty
The October 2022 ARVIC virtual conference drew insights and product professionals from companies including Roku, T-Mobile, Lyft, and JM Smucker. Across four talks, a consistent thread ran through the sessions: the gap between data that exists and insight that actually drives decisions is a structural problem, and researchers can close it through smarter program design, cleaner operational habits, and sharper communication. The sessions covered behavioral data integration, mobile engagement measurement, self-serve research scaling, and presentation craft, each grounded in real programs rather than theoretical frameworks.
Connecting Behavioral Data to Survey Research
Two talks explored how brands with large first-party or proprietary datasets can turn behavioral signals into a research advantage. At Roku, appending behavioral log data to email surveys before fielding allowed the team to eliminate screener questions, reduce survey length, and avoid relying on claimed behavioral responses that respondents frequently misremember. The trade-off is operational: legal review, contact exclusion lists, sampling discipline, and privacy guardrails (including GDPR compliance) must all be in place before a single email goes out, not after.
T-Mobile Advertising Solutions demonstrated a complementary approach, using proprietary mobile app engagement data collected across millions of devices to measure brand loyalty without asking a single survey question. Metrics like time in app, login frequency, and post-install retention function as measurable loyalty proxies and can be tracked across competing apps simultaneously. The case study on music streaming apps showed how engagement patterns map closely to established brand loyalty rankings, and how co-installed app data can build audience personas precise enough to inform re-engagement targeting.
- Behavioral data belongs in the analysis layer as a filter for attitudinal findings, not as a finding in itself.
- Privacy and consent design are foundational, not afterthoughts. Both programs built opt-out and compliance mechanisms into their core architecture.
- Response rates on unincentivized email surveys run around one to two percent; operational expectations and send volumes should be set accordingly.
- Post-install retention drops sharply in week one across apps, making that window the most critical signal for loyalty and re-engagement strategy.
Scaling Research Capacity Without Scaling Headcount
Lyft's rapid research program addressed a problem many insights teams face: demand that outpaces researcher supply. The solution was a structured self-serve model that trains non-researchers to moderate interviews with real customers, supported by researcher-built templates, intake forms, and mandatory dry runs. Running up to six simultaneous project teams in a single session lets multiple product teams get usable findings in one afternoon. The researcher's role shifts from sole executor to program architect and quality gate.
A notable secondary benefit of the parallel session format is cross-pollination. Teams hear findings from adjacent projects they would never encounter in isolated studies, generating knowledge transfer that compounds over time. The program also proved self-reinforcing: trained partners improve, build a research culture, and sustain demand, which justified dedicated headcount to run the program full time.
- Rapid research is best suited to focused, time-sensitive questions answerable in 20-minute moderated interviews: design comparison, usability testing, and concept testing.
- It is not a replacement for surveys, multi-phase studies, or contextual inquiries.
- Recruit six participants per session with one to two floaters. General population recruitment is simpler and less biasing than tight persona matching.
- Five-minute breaks between 20-minute slots, rather than one long batch break, are necessary for both participants and moderators to reset.
Presenting Research So It Actually Gets Used
The conference closed with a practical look at presentation craft, a skill that determines whether good research drives decisions or gets filed away. The core argument: researchers doing DIY or vendor-managed work are already at a credibility disadvantage versus full-service agencies, and weak slide design makes that gap worse before anyone reads a word. Simple, polished visuals signal competence. Dense tables and Excel outputs do not survive a live meeting.
- Replace complex index charts with one bold graphic, one key stat, and a clear label of who over-indexes.
- Apply the log line test to every slide: if you cannot write one sentence explaining why it is in the deck, cut it.
- Build two versions of every presentation. A detailed 'scuba diving' deck for technical stakeholders, and a distilled 'snorkeling' deck of essential takeaways for leadership.
- Front-load key takeaways at the opening. If the conversation derails early, the core message is already on the table.
- Track who brings you problems and whether your research informs tactical or strategic decisions. Both are meaningful signals of growing organizational credibility.
Presentations
 01
01Jobs to Be Done in the Real World: A Case Study from Promethean
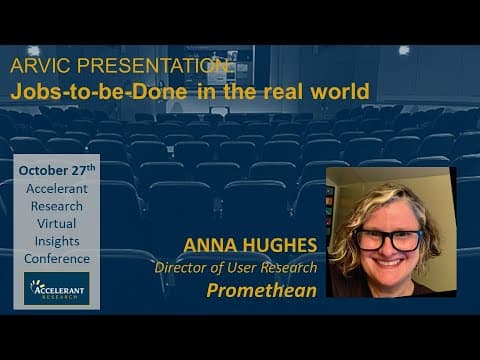
Anna Hughes, Director of User Research at Promethean, walks through how her team applied the Jobs to Be Done (JTBD) framework to a real classroom management product challenge. Over five weeks, the team moved from a sprawling prototype with vague value propositions to a prioritized set of hero features grounded in quantified teacher needs. The talk covers the full process: scoping the job hierarchy, structured qualitative interviews, metric collection, survey-based quantification, and value proposition development.
Watch the talk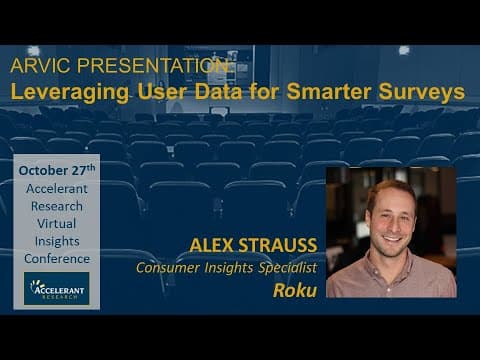 02
02Leveraging User Behavioral Data for Smarter Email Surveys
Alex Strauss, Consumer Insights Specialist at Roku, walks through how Roku built a program that connects behavioral log data to email survey research. The talk covers why integrating behavioral data improves survey efficiency, how to stand up the program across internal teams, and what to watch out for during sampling, fieldwork, and analysis. The approach is most relevant to brands with large first-party databases looking to reduce survey length, improve targeting, and eliminate reliance on claimed behavioral responses.
Watch 03
03Mind the Gap: Elevating Your Research Presentations
Heidi Kerian, Senior Scientist on the Consumer Foods team at JM Smucker, shares practical techniques for bridging the gap between doing research and presenting it convincingly. Drawing on a self-taught background in qualitative and quantitative research across R&D, product design, and CPG roles, she focuses on three pillars: visual aesthetics, storytelling for clarity, and embracing feedback. The talk is aimed at researchers who do DIY or vendor-managed work and want to build credibility with both technical teams and leadership.
Watch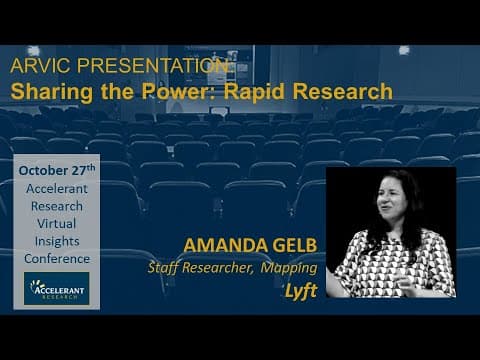 04
04Sharing the Power of Rapid Research: A Self-Serve Program for Cross-Functional Teams
Amanda Gill, a researcher at Lyft, describes how she built a rapid research program to meet overwhelming demand as a solo researcher in Lyft's New York office. The program trains non-researchers to conduct moderated interviews with real customers, with researcher support at key moments, so multiple product teams can get usable insights in a single session. The talk covers project selection, moderation training, session logistics, synthesis support, and how the program scaled across the company.
Watch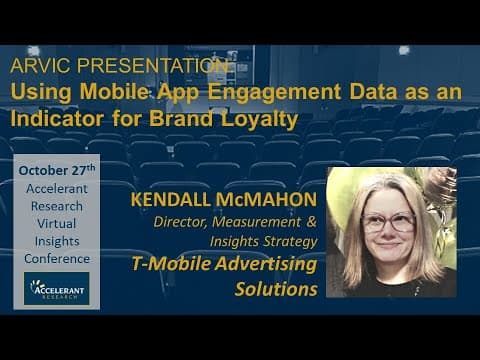 05
05Using Mobile App Engagement Data as an Indicator for Brand Loyalty
Kendall McMahon, Director of Measurement, Insights, and Strategy at T-Mobile Advertising Solutions, walked through how T-Mobile collects and scales proprietary mobile app engagement data from millions of devices. Using music streaming apps as a case study, she showed how metrics like session duration, focus frequency, and post-install retention correlate with brand loyalty, and how brands can use this data to identify their core audience and improve targeting.
WatchWant to be in the room next time?
Register for next conferenceRelated conferences
June 2022 ARVIC
The June 2022 ARVIC conference focused on rigorous, practical pricing research, offering researchers and product teams a clear framework for choosing and executing the right methodology.
ViewMarch 30, 2023March 2023 ARVIC
The March 2023 ARVIC conference brought together practitioners to advance research methods, organizational capability, and the translation of insights into decisions that actually get used.
ViewApril 28, 2022April 2022 ARVIC
The April 2022 ARVIC conference brought together research and product practitioners to examine inclusive design principles, distributed team cohesion, and methodological rigor in survey fielding.
ViewPresent at the next ARVIC
Share a method, a study, or a hard-won lesson with a room of senior research practitioners.